

THC percentage tells you how much delta-9 THC is present by weight. That’s the whole conversion in one line.
What gets confusing is that labels don’t always show the same thing. Some display delta-9 THC directly. Others show THCA (the raw, non-intoxicating precursor) or a combined “total THC” figure. Knowing which one you’re looking at changes everything about how you interpret the number.
Quick conversion reference:
- 1 gram = 1,000 mg, so multiply the percentage by 10 to get mg per gram
- 20% THC flower corresponds to about 200 mg per gram; a 0.5 g joint contains about half that amount
- 0.7% THC (a low-potency product) corresponds to about 7 mg per gram
- A 0.25 g dose of 18% flower contains a calculated amount of THC based on these percentages, though actual absorbed THC is lower
The label may say “delta-9 THC,” “THCA,” or “total THC.” Each is a different measurement. Washington State’s cannabis authority requires THC concentration to be listed on every product and caps edible servings at 10 mg THC with a 100 mg per package maximum.
Key Takeaways
THC percentage measures delta-9 THC by weight, and converting it to milligrams (multiply by 10 per gram) is the most practical skill for dosing any cannabis product accurately.
| Point | Details |
|---|---|
| Percentage = mg per gram | Multiply the THC % by 10 to get mg per gram (20% = 200 mg/g). |
| Total THC is a maximum | The formula (0.877 × %THCA) + %THC gives a theoretical ceiling; actual absorbed THC is lower. |
| Edibles use mg, not % | For edibles, the mg-per-serving figure is what matters; start at 2.5–5 mg if you’re new. |
| Higher % doesn’t mean proportionally stronger | Controlled research found similar intoxication across 16%–24% flower and 70%–90% concentrates. |
| COA date and terpenes matter | Always check the test date, batch number, and terpene panel alongside the potency figure. |
Table of Contents
- What does THC percentage mean on a lab report?
- How THC is reported across flower, concentrates, and edibles
- Does higher THC actually mean a stronger effect?
- How to read a product label and COA
- Common myths about THC percentage
- Why THC percentage is just one piece of the picture
- Sources
What does THC percentage mean on a lab report?
The number on a label comes from a laboratory test, most commonly using high-performance liquid chromatography (HPLC), a method that separates and quantifies individual cannabinoids without applying heat. That matters because HPLC measures THCA and delta-9 THC as distinct compounds, which is why you’ll often see both listed separately on a Certificate of Analysis (COA).
The total THC formula accounts for the fact that THCA converts to delta-9 THC when heated. According to Leafly’s cannabinoid measurement guide, the standard calculation is:
(0.877 × %THCA) + %THC = Total THC
The 0.877 factor reflects THCA’s higher molecular weight. When it loses a carboxyl group during heating (decarboxylation), some mass is lost, so you never get a 1:1 conversion. The “total THC” on a label is a theoretical maximum, not a guaranteed dose.
Lab-to-lab variability adds another layer of uncertainty. Different labs use different calibration standards, sampling protocols, and equipment. Audits have documented cases of inflated potency reporting, driven partly by market incentives: dispensaries and brands know consumers reach for higher numbers. The result is a practice sometimes called “lab shopping,” where producers test with multiple labs and publish the highest result.
Key sources of reported-number variability:
- Sampling bias (only a portion of a batch is tested)
- Degradation from light, heat, and oxygen between test date and purchase
- Calibration differences across laboratories
- Decarboxylation assumptions built into the total THC formula
Pro Tip: Always check the COA’s test date and batch number before trusting a potency figure. A COA from six months ago on a product sitting in warm storage may not reflect what’s actually in the jar today.
How THC is reported across flower, concentrates, and edibles
The unit on the label depends on the product type, and mixing them up leads to real dosing errors.
| Product Type | Label Unit | Typical Potency Range |
|---|---|---|
| Flower | % THC or total THC | a common range includes mid-teens up to around 30% |
| Vape cartridges / concentrates | % THC | typically high percentage ranges |
| Edibles | mg per serving / mg per package | 2.5–10 mg per serving |
Flower and concentrates are expressed as a percentage because the consumer controls the dose by how much they consume. Edibles are sold in fixed servings, so milligrams per serving is the only number that’s actually useful for dosing.
Worked conversions:
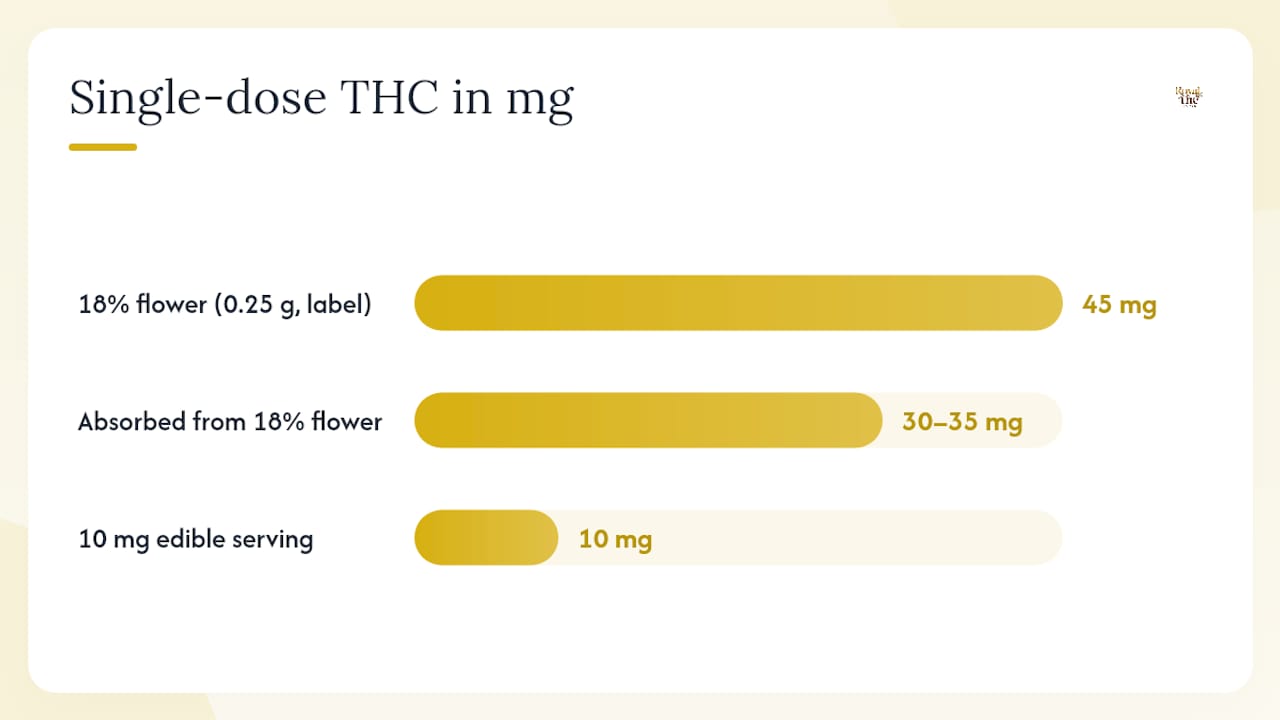
- 18% flower, 0.25 g dose: 0.25 × 1,000 × 0.18 = 45 mg total THC on paper. After conversion losses, absorbed THC is likely 30–35 mg.
- 10 mg edible serving: The label already tells you the dose. No math needed, but note that onset takes 30–90 minutes, so the serving size is the whole story.
But as University of Colorado researchers found, higher measured THC percentages don’t always produce proportionally greater intoxication. Receptor saturation and self-titration behavior both play a role. The number is real; the linear dose-response assumption is not.
Two products with identical THC percentages can also feel completely different. Terpenes and minor cannabinoids shape the character of the experience in ways the potency sticker can’t capture. For a deeper look at how terpene profiles shape your session, the terpene profiles guide for cannabis vapers is worth reading alongside the label.
Does higher THC actually mean a stronger effect?
Not reliably. The relationship between THC percentage and subjective intoxication is weaker than most consumers assume, and the evidence is specific enough to be worth stating plainly.
Practical dosing by route:
- Inhalation (flower/vape): Start with one small puff, wait 5–10 minutes, and assess before taking more. Effects peak within 15–30 minutes.
- Edibles: Start with 2.5–5 mg for a first session. Wait at least 90 minutes before considering a second dose. The delayed onset is where most overconsumption happens.
- Concentrates: Treat a small dab as a full dose regardless of the percentage on the label.
Tolerance changes the equation significantly. The percentage on the label says nothing about your individual receptor sensitivity, which is why starting low is the only universal rule that holds.
Pro Tip: If you’re new to vaping THC, a beginner-focused session guide can help you set realistic expectations before you look at potency numbers at all.
High-THC products carry real risks for inexperienced users. Accidental overconsumption, particularly with edibles, can cause acute anxiety, elevated heart rate, and disorientation. These effects are temporary but distressing. The dose that’s unremarkable for a regular user can be overwhelming for someone with low tolerance.
How to read a product label and COA
A COA is the document that actually backs up the label claim. Here’s what to check:
- Delta-9 THC vs. THCA vs. total THC: Confirm which figure the label is using before calculating a dose
- Serving size in mg: For edibles, this is the most important number on the package
- Batch number: Matches the COA to the specific production run you’re holding
- Test date: Older COAs may not reflect current potency after storage
- Accredited lab name: Look for ISO 17025 accreditation as a baseline quality signal
- Contaminant screens: Pesticides, heavy metals, residual solvents, and microbials should all show passing results
- Terpene panel (if listed): Gives you a better picture of the likely experience than THC alone
No COA at all means no verification. A COA with no batch number can’t be tied to the product in your hand.
For THCA vs. delta-9 THC differences explained in full, that resource covers the chemistry clearly.
Common myths about THC percentage
Myth 1: Higher THC always means a stronger high.
The University of Colorado study found similar intoxication levels among users consuming flower in a certain moderate to high THC range, as well as among users of concentrates with different high THC percentages. These are limited-sample findings, but they’re controlled and specific. The plateau effect is real enough to take seriously.
Myth 2: The percentage on the label is exact.
It’s a snapshot from one sample of one batch, tested on one day. Sampling variability, degradation, and lab differences all mean the actual number in your product may differ from what’s printed.
Myth 3: THC percentage is the best quality signal.
Industry experts describe the high-THC arms race as a numbers game that rewards inflated potency over preserved terpene profiles and well-cured flower.
The entourage effect, where terpenes and minor cannabinoids interact with THC to shape the overall experience, is why two products at the same percentage can feel so different. Percentage tells you the concentration of one compound. It says nothing about the other 400+ compounds present.
Why THC percentage is just one piece of the picture
The percentage number is useful, but it’s a starting point, not a verdict. After years of watching consumers reach for the highest number on the menu, the pattern is clear: the people who get the most consistent, enjoyable experiences are the ones who learn to read the full COA, pay attention to terpene data, and dose by serving size rather than by percentage.
Percentage tells you the concentration of one compound in a complex product. It doesn’t tell you how fresh the flower is, how well it was cured, what the terpene profile looks like, or how your individual tolerance will respond.
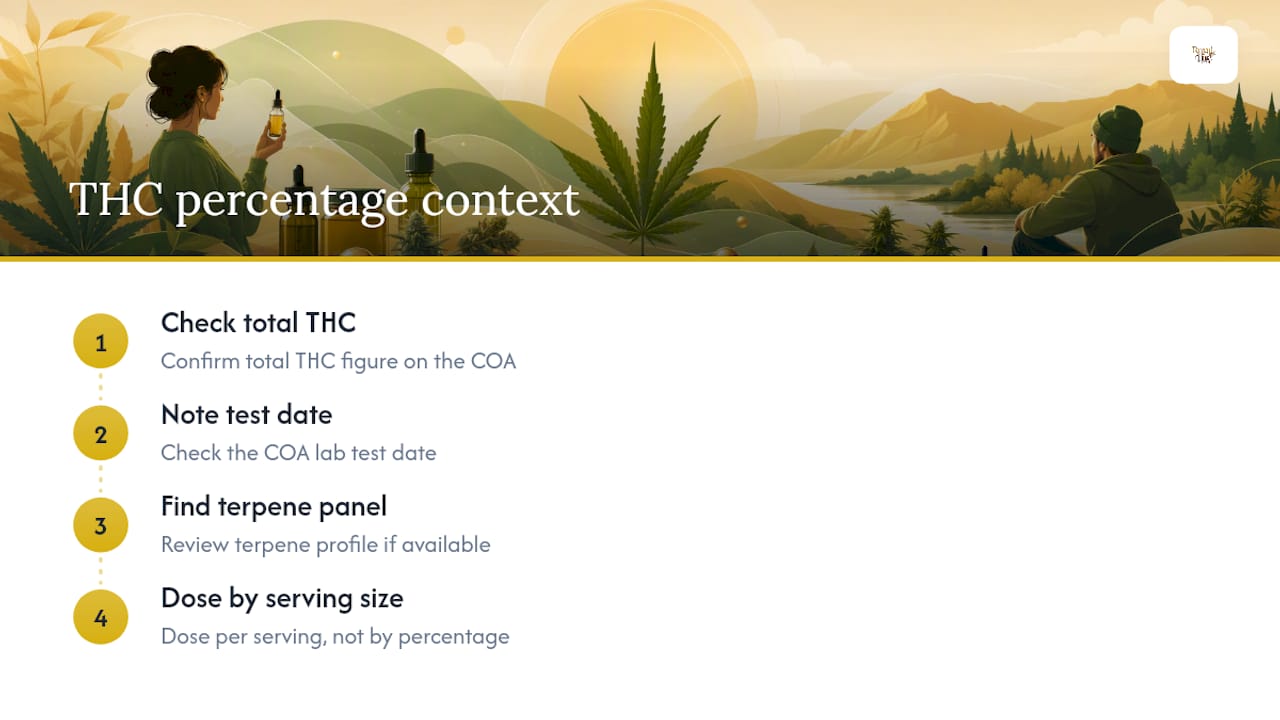
The practical habit worth building: check the total THC figure, note the test date, find the terpene panel if one exists, and dose by serving size. That four-step check takes 60 seconds and tells you far more than the headline number alone.
Thcvapesuk carries lab-tested products with COA documentation precisely because that transparency is what makes the percentage number trustworthy in the first place.
Thcvapesuk stocks lab-tested THC vapes, cartridges, and disposables from verified brands, with COA documentation available so you can check the numbers before you buy. Whether you’re starting out or dialing in a specific experience, the product range covers potency levels and strain types to match.

Sources
- Understanding THC concentration and potency
- How to Measure THC & CBD Levels in Cannabis Products | Leafly
- Why THC Percentage Doesn’t Equal Cannabis Quality | Weedmaps
- Marijuana concentrates sharply spike THC levels — don’t necessarily get users higher
This article is general information, not a substitute for advice from a qualified doctor. Consult a qualified healthcare professional about your own circumstances before acting on anything here.
